6. Piecewise functions *
Piecewise functions
In many cases, a function gets values according to a different rule with different variable values. For example, you can get a quantity discount on your purchases. Similarly, the more salary you earn, the higher your tax rate will increase. The change in the calculation method is clearly noticeable from the graph of the function, which seems to consist of several different pieces. This is a piecewise function. A piecewise function is continuous if its graph is a continuous curve. Otherwise, the function is said to be discontinuous.
Example 1
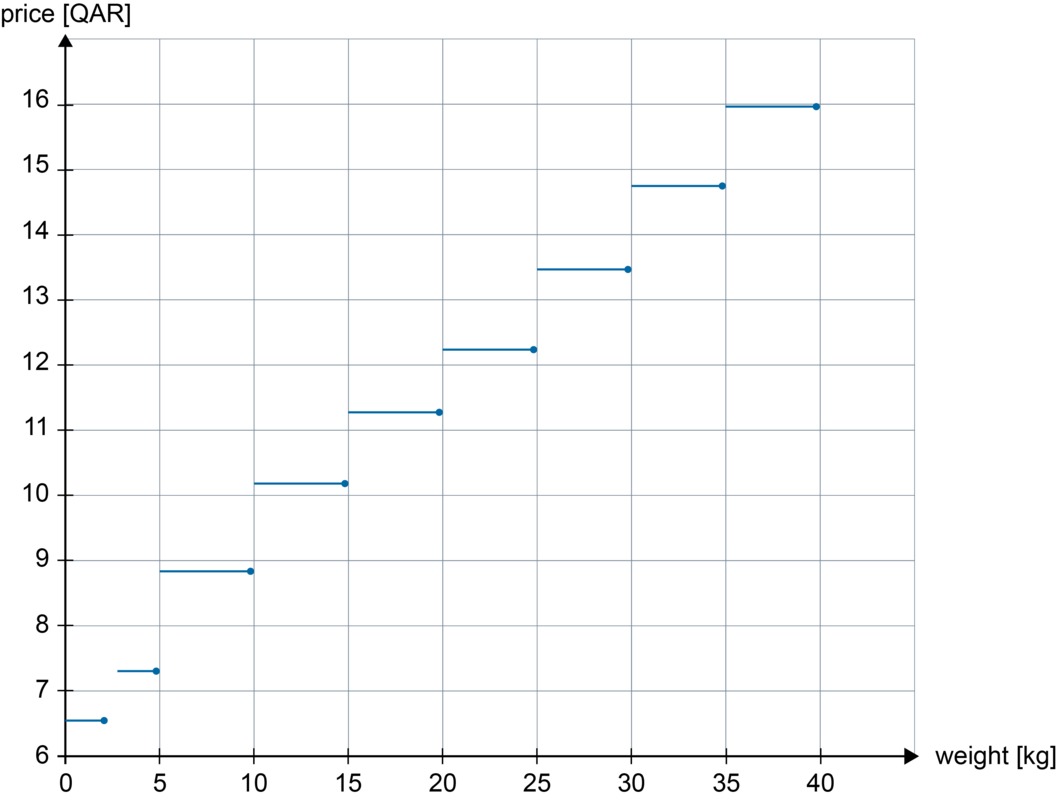
The table below shows the dependence of the postage price on the size and volume of the parcel sent to the home country. Draw a graph of package price formation by weight.
| maximum weight [kg] | maximum volume [m3] | price with tax [QAR] |
|
2 |
0,008 |
6,60 |
|
5 |
0,020 |
7,40 |
|
10 |
0,040 |
8,80 |
|
15 |
0,060 |
10,10 |
|
20 |
0,080 |
11,40 |
|
25 |
0,100 |
12,30 |
|
30 |
0,120 |
13,50 |
|
35 |
0,140 |
14,70 |
|
40 |
0,160 |
15,90 |
It doesn’t matter if the package weighs one or two kilograms, as long as the volume doesn’t change across the limits. This means that for all packages under [[$ 2 $]] kg and [[$ 0,008 $]] m3, the price is the same at [[$ 6,60 $]] QAR. In this case, the graph between 0 and 2 kg is straight along the horizontal axis. When the weight exceeds [[$ 2 $]] kg, the fee jumps to [[$ 7,40 $]] QAR and stays there until the package weighs more than [[$ 5 $]] kg, etc. The graph thus consists of short lines that are perpendicular to the horizontal [[$ x $]]-axis. The circles at the end of the horizontal lines highlight the point from which the value of the function is to be read at the joints. According to the definition of a function, a function must have no more than one value at one point!

Example 2
Levi's daily wage was set at [[$ 6,50 $]] QAR for the first two hours and at [[$ 11,50 $]] QAR for the following hours. Construct the function for Levi's wage.
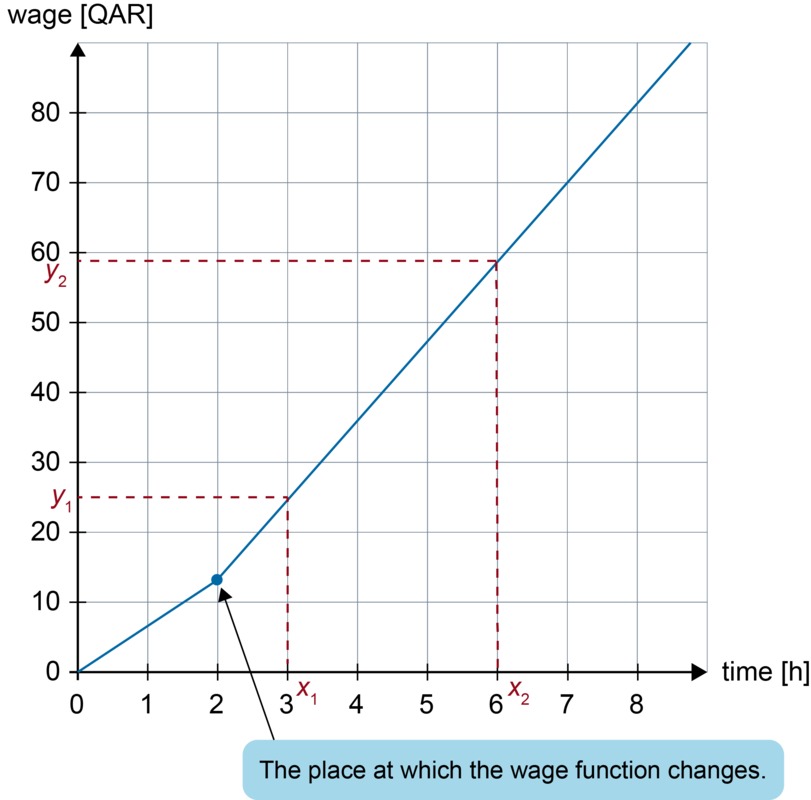
First, let's draw a graph of Levi's salary to find out the equations.

The wage for the first two hours is obtained from the equation [[$ y = 6,50x $]].
In order to be able to determine for the line an equation that describes wage after two hours, we take two viewpoints [[$ (x_1, y_1) $]] and [[$ (x_2, y_2) $]] from the line starting at two hours in order to calculate slope of the line.
[[$ k = \displaystyle\frac {y_2 - y_1} {x_2 - x_1} = \displaystyle\frac {59,00 - 24,50} {6 - 3} = 11,50 $]].
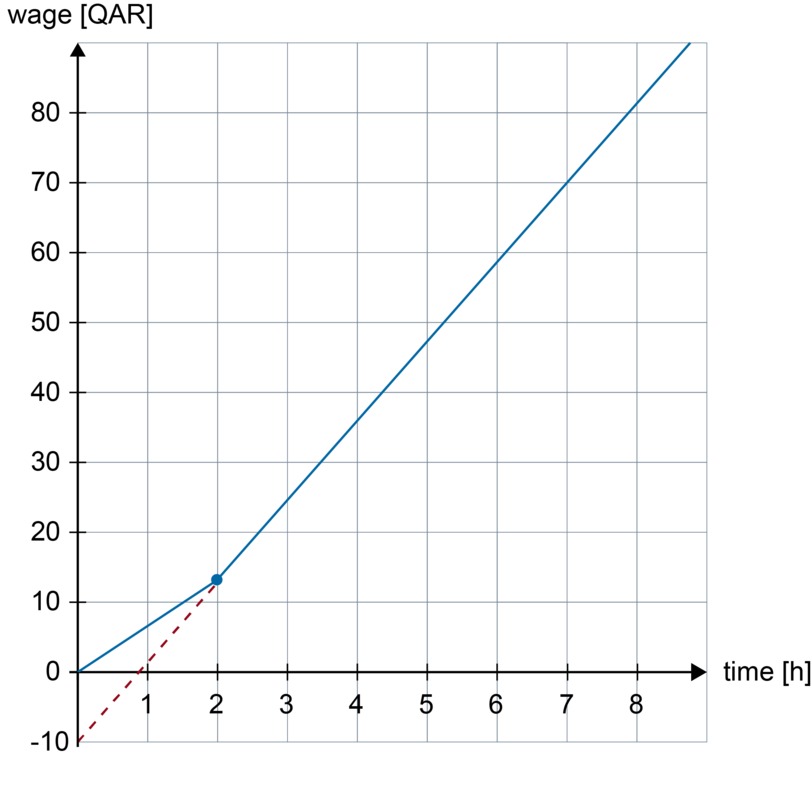
To write the equation, you still need to know where the graph intersects the [[$ y $]]-axis. Determine the intersection point by drawing an extension to the line.

The extension of the line intersects the [[$ y $]]-axis at [[$ y = -10 $]]. This means that the equation of the line is [[$ y = 11,50x -10 $]].
For the first two hours, the wage is calculated with the equation [[$ y = 6,50x $]]. After two hours, the wage is calculated with the equation [[$ y = 11,50x - 10 $]]. The expression for a piecewise function is written in the following form:
Note! Undone hours are not paid, so it does not make sense to use the function for negative values. This becomes a condition [[$ 0 ≤ x ≤ 2 $]] and not just [[$ x ≤ 2 $]].
Exercises
Basic exercises
1/06. Submission folder for answers
Sinulla ei ole tarvittavia oikeuksia lähettää mitään.