3. The graph of a function
The graph of a function
There are two different types of functions: experiential and mathematical functions. Experiential functions are plotted on the basis of measurements made from a certain phenomenon. For example, temperature cannot be plotted as a function of time without performing measurements. Temperature and time are independent of each other, which means that temperature cannot be calculated on the basis of time alone.
When a pair of numbers are bound together at one point by some mathematical equation, the second value of the pair of numbers can be calculated when the other value and the equation are known. Measurements do not necessarily have to be taken if you want to plot a graph of the volume of a sphere as a function of its radius. An existing mathematical equation can be used. The dependence between the sphere's radius and volume is precise, and the points are located exactly on a certain type of curve.
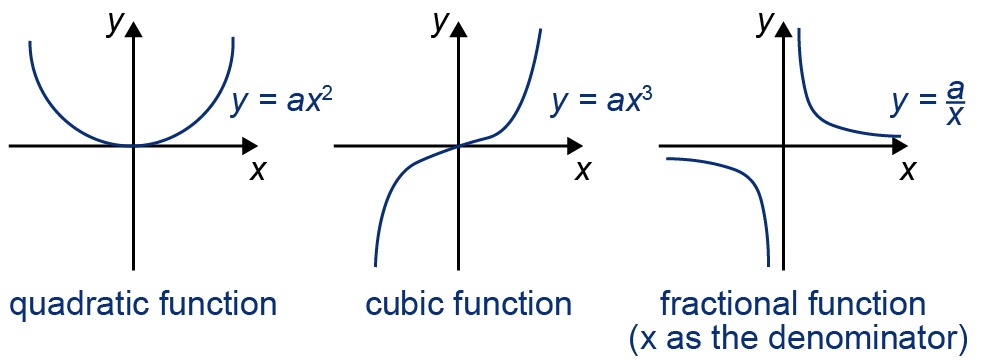
It is often more illustrative to present functions graphically instead of as pure mathematical expressions. The graph of a function can also be used to determine the value of a function at points where no measurements have been made. The shape of a function graph is determined by its degree.
The degree of a function is given by the highest exponent of the variable in the equation.
If the graph of the function is straight, it is always a first-degree or linear polynomial function. The graphs of higher-degree functions are curvilinear. The graph of the quadratic function is introduced in the third part of the book.

Example 1
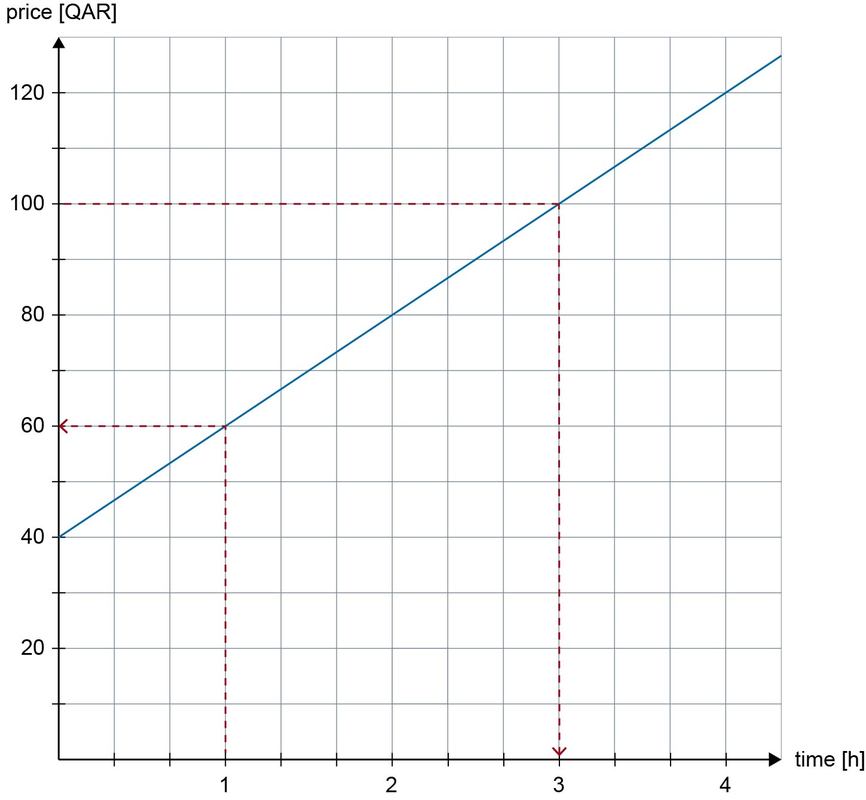
The car repair shop charges its customers as follows: the prices of spare parts are paid as is, whereas the cost of the repair operation itself is paid according to the time it takes. The price of the work is thus a function of time, which can be represented with a graph.

Values can be read from the graph in both directions:
- If the time spent on the work is [[$ 1 $]] h, the price of the work is [[$ 60 $]] QAR. That is, with the value of the variable [[$ 1 $]] h, the function gets the value [[$ 60 $]] QAR.
- If the repair operation costs [[$ 100 $]] QAR, then the time it takes is [[$ 3 $]] h. That is, the function gets the value [[$ 100 $]] QAR with the variable value of [[$ 3 $]] h.
However, not all values can be read from a graph. For example, the cost of a five-hour repair is not immediately apparent. By extending the graph line, the cost can also be determined for longer repair times. Another option is to construct a function expression based on the graph to calculate the cost for any length of correction time. This is discussed in the following chapter.
Exercises
Basic exercises
Applied exercises
1/03. Submission folder for answers
Sinulla ei ole tarvittavia oikeuksia lähettää mitään.