10.6 Climate diagrams
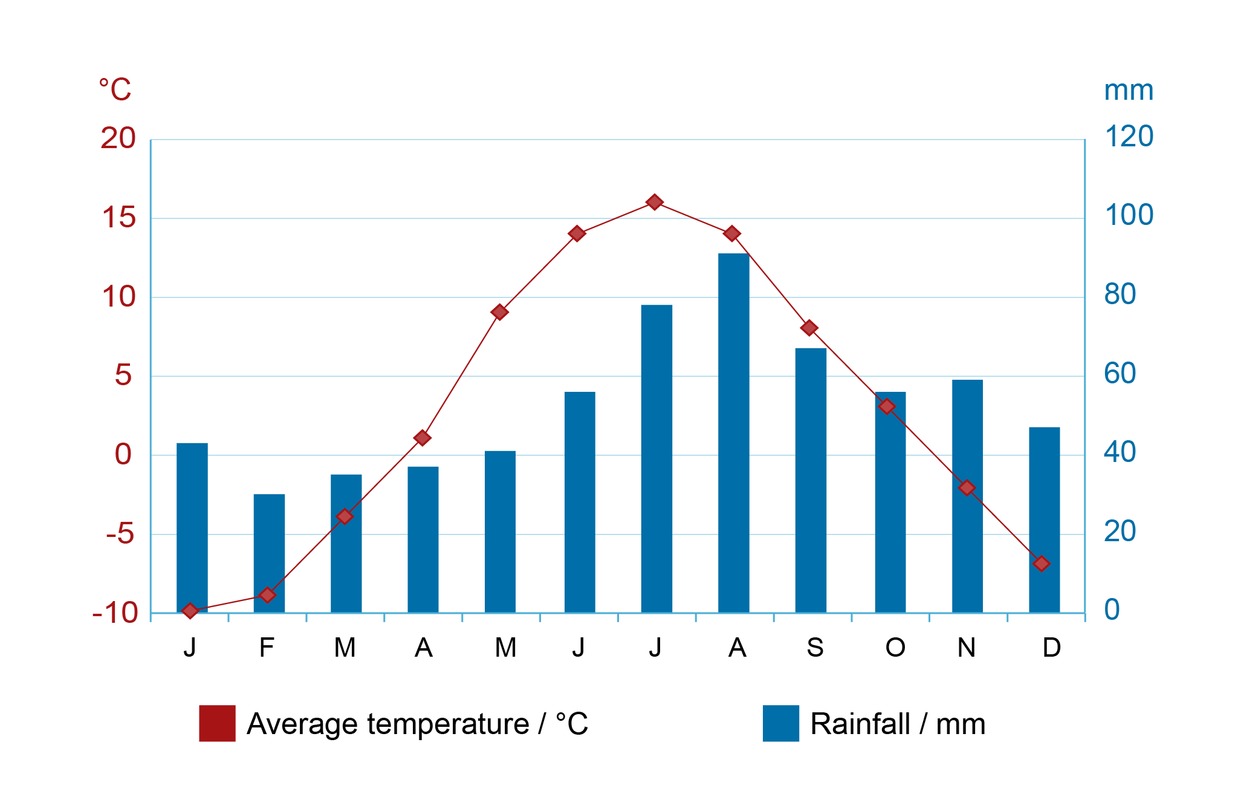
Climate diagrams are used to display the temperature and precipitation of a certain region. A climate diagram consists of two parts: a line graph and a bar chart. The line graph shows the changes in monthly average temperature, whereas the bar chart displays the amount of monthly rainfall. Months are often marked by their initial letters or numbers.
The left-hand side of the climate diagram shows the temperature scale either in Celsius or Fahrenheit. The right-hand side of the diagram displays the precipitation in millimeters.
A climate diagram provides an overall picture of the climatic conditions of a certain area.

The left-hand side of the climate diagram shows the temperature scale either in Celsius or Fahrenheit. The right-hand side of the diagram displays the precipitation in millimeters.
A climate diagram provides an overall picture of the climatic conditions of a certain area.
