14. Solving an inequality graphically
Solving an inequality graphically
First-degree inequality
In an inequality, the equals sign is replaced by one of the signs [[$ <$]], [[$> $]], [[$ ≤ $]], [[$ ≥ $]], [[$ ≠ $]].A first-degree inequality is solved in the same way as a first-degree equation, except that when multiplied or divided by a negative number, the direction of the inequality sign changes.
Example 1
Solve the inequality [[$ -9x + 16 ≥ -x $]] and illustrate the solution with a number line.
[[$ \begin{align*} -9x + 16 &≥ -x \\ -9x + x &≥ -16 \\ -8x &= -16 \;\;\;\;\;\;\ || \; :(-8) \;\;\;\;\ {\color{blue}{\text {The direction of the inequality sign changes!}}} \\ x &≤ \displaystyle\frac {-16} {-8} \\ x &≤ 2 \end{align*} $]]
Thus, the inequality holds when [[$ x $]] is [[$ 1 $]], [[$ -3 $]], or even [[$ -4, \! 456 $]]. The large number of solutions is easy to illustrate with a number line.

An inequality is when the equals sign in equation is replaced by one of the symbols describing the inequality.
Inequality signs
[[$ ≠ \;\; $]] is not equal to[[$ < \;\; $]] is less than
[[$ > \;\; $]] is greater than
[[$ ≤ \;\; $]] is less than or equal to
[[$ ≥\;\; $]] is greater than or equal to
Inequalities can be illustrated using graphs in the same way as functions and equations. Inequality analyses have previously been made on a number line basis only. However, the numeric line is only suitable for illustrating inequalities along the [[$ x $]] and [[$ y $]] axes. More extensive observations can be made in the coordinate system, where the inequalities of the two variables can also be illustrated.
Example 2
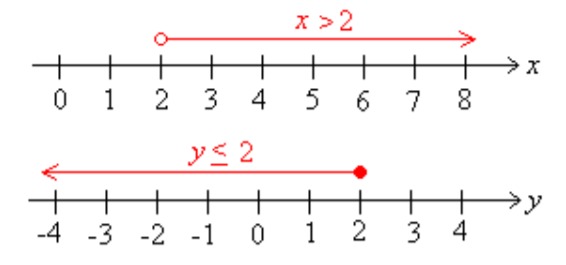
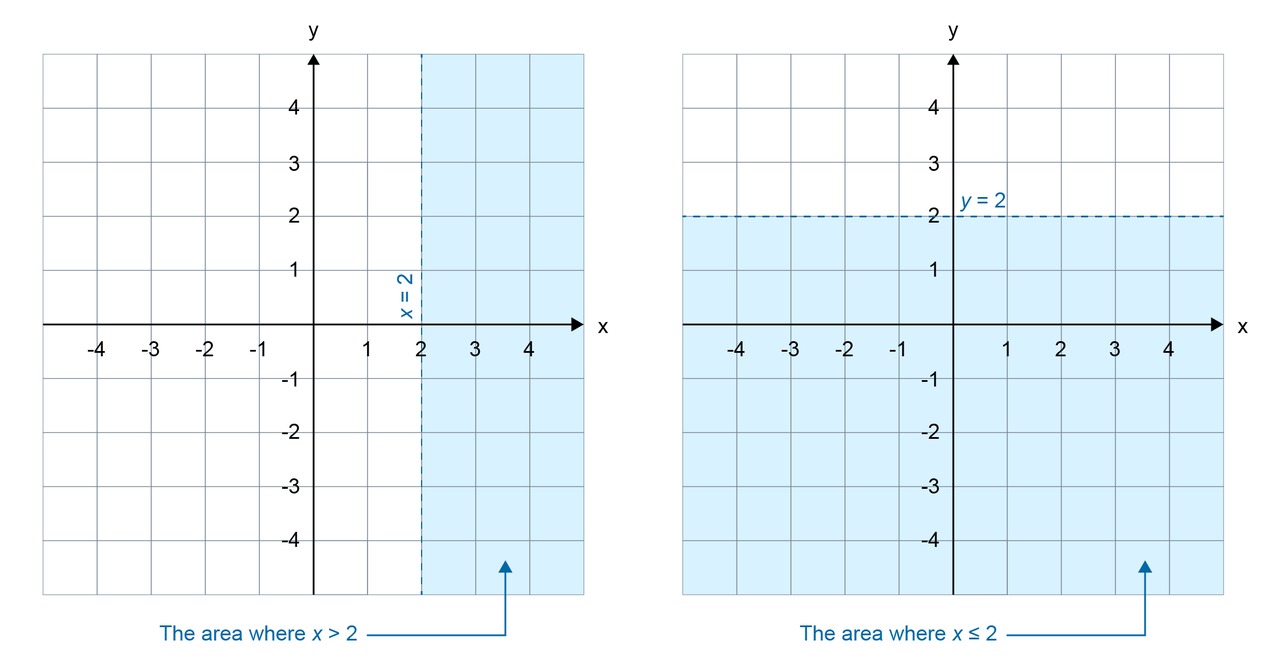
Illustrate the inequalities and [[$ x> 2 $]] and [[$ y ≤ 1 $]] a) on a number line b) in the coordinate system.
Example 3
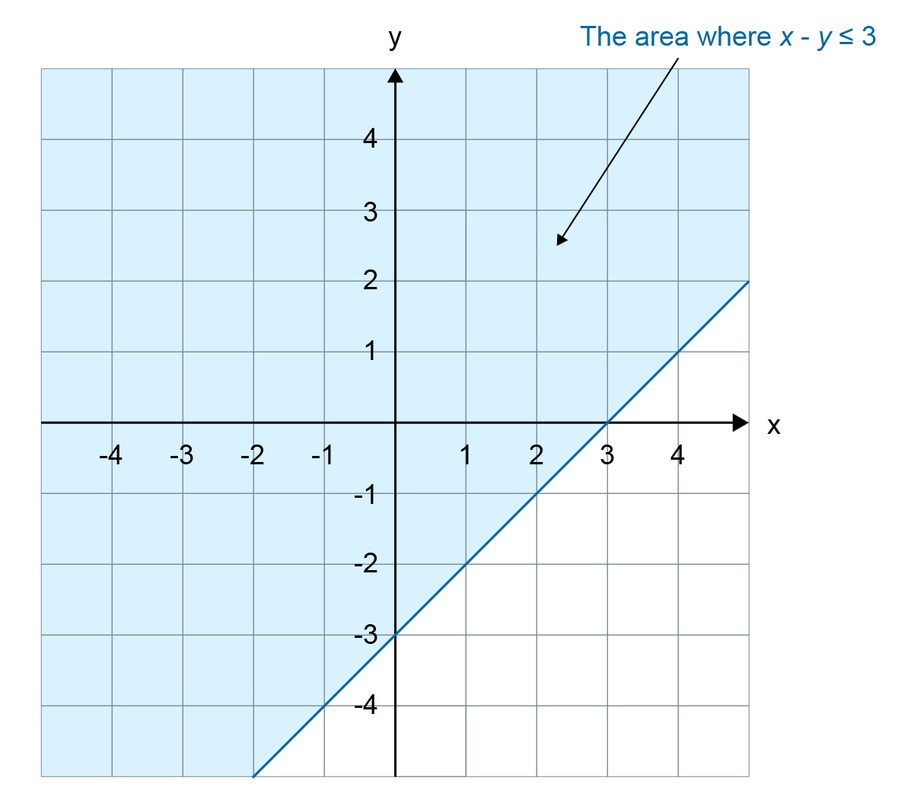
Draw an image of the area [[$ y - x ≤ 3 $]] in the coordinate system.
Solution:
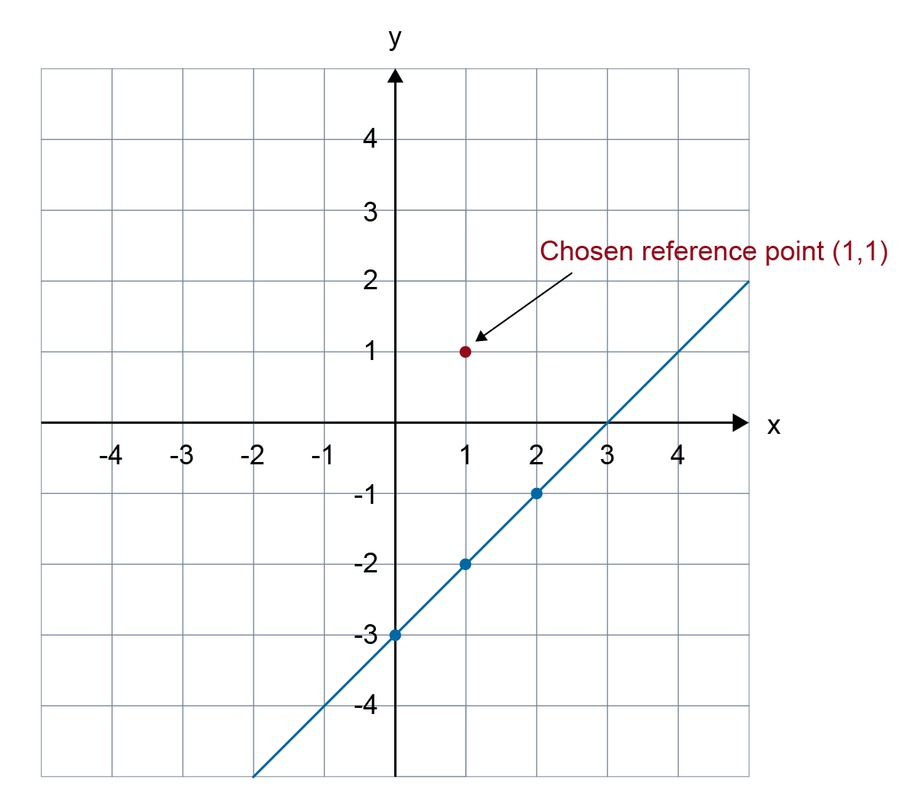
Let's start with the line [[$ y - x = 3 $]], because this will be the boundary of the range. Write the equation in a more familiar form, with the variable [[$ y $]] on the left side and all other terms on the right side: [[$ y = x + 3 $]]. Draw a line in the coordinate system.
The problem is that which side of the line satisfies the inequality. To find out select an observation point on either side of the line and consider whether this point satisfies the inequality.

Select [[$ (1, 1) $]] as the reference point. Placing that point in the inequality [[$ y - x ≤ 3 $]] gives the following result:
[[$ \begin{align*} 1 - 1 &≤ 3 \\ 0 &≤ 3 \\ \end{align*} $]]
It is true that zero is less than three, so the reference point [[$ (1, 1) $]] belongs to the range [[$ y - x ≤ 3 $]].
Thus, the top of the line [[$ y = x + 3 $]] implements the inequality [[$ y - x ≤ 3 $]]. Let's shade this area from the coordinate system.

Exercises
Basic exercises
Applied exercises
Challenging exercises
1/14. Submission folder for answers
Sinulla ei ole tarvittavia oikeuksia lähettää mitään.

